TensorFlow, Object Detection, Lancaster City PA Row Houses, Social Ecology
This is an exploration with machine learning using TensorFlow Object Detection Models. If a TensorFlow model can be trained to detect row houses, is it possible to be trained to detect row houses of varying styles, and if so, can the detection model eventually tell us about the visual makeup of different areas within a city? There have been a few conceptualizations of neighborhood definitions in Lancaster City PA over the past 40 years or so (link). Is it possible to couple machine learning object detection methods with individuals' ideas of their neighborhood boundaries to create a visual representation of neighborhoods that reflects their experience within the definition of their lived neighborhood space?
TensorFlow Object Detection Setup
- The following is a list of highlights/lowlights from going through a TensorFlow tutorial:
- The CPU variant of TensorFlow was used
- The Anaconda package manager was not used (although personally I would use it next time)
- Step-bystep instructions were very good
- The Jupyter Notebook instance would not display result images within the notebook due to some backend configuration I didn't bother to run down, I just set the images to be saved to disk somewhere else
- I renamed the project directory at one point due to a misspelling that I changed, and that broke the paths to the Virtual Environment packages. It was fixed by updating the paths manually within the VirtualEnv
- I skipped the section titled Detecting Objects Using Your Webcam
Getting Images to Train the Model
The following section describes the process of using the Google Street View API to collect images. 500 images were gathered from Google Street View API with the following method
- Street View API requirements
- API Key: obtained through registration with Goolge Cloud
- Location: latitude and longitude values
- Size: image output size (using 600x600)
- Heading: compass heading (0 & 360 are grid north)
- Radius: Distance in meters for search radius area to find a Google pano ID (using 10 meters)
- Get street geometries
- Query street geometies for Street View API parameters
- Script API calls to download images First the script makes a call to the metadata endpoint to see if there is an image available for the parameters given. If an image is available it grabs the image and saves it for each perpendicular heading.
- Train the model
- Draw and label objects with LabelImage
- Using default model from the tutorial
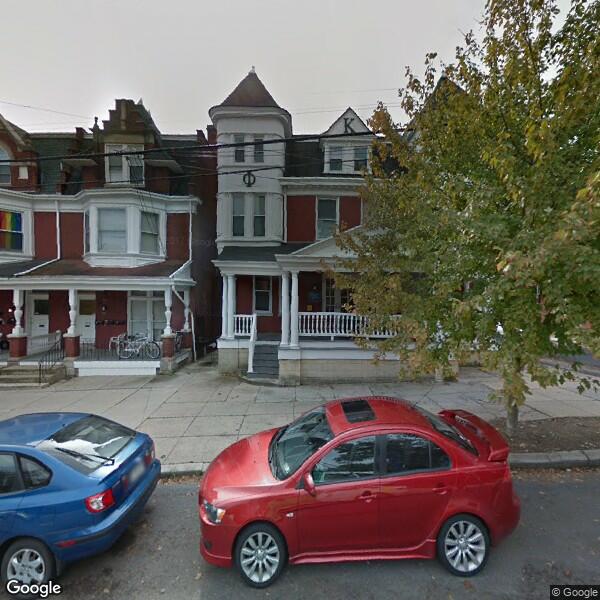
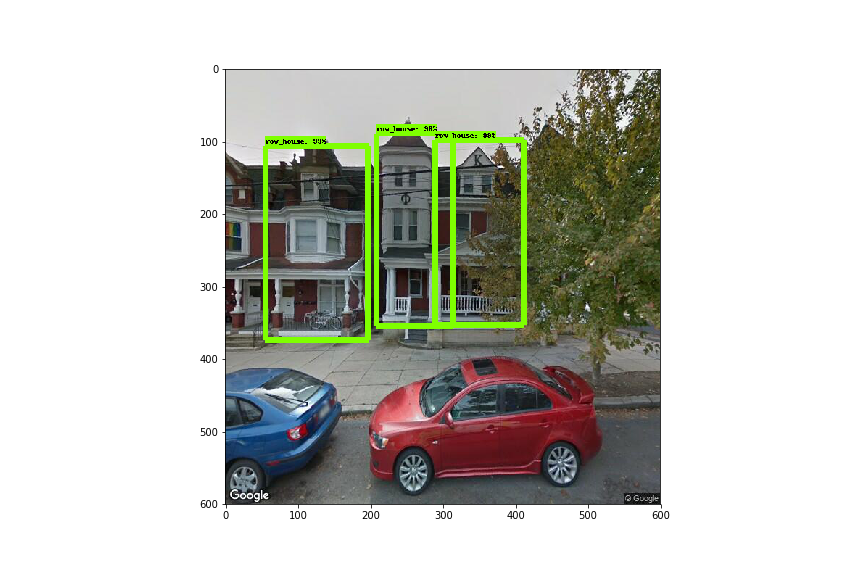
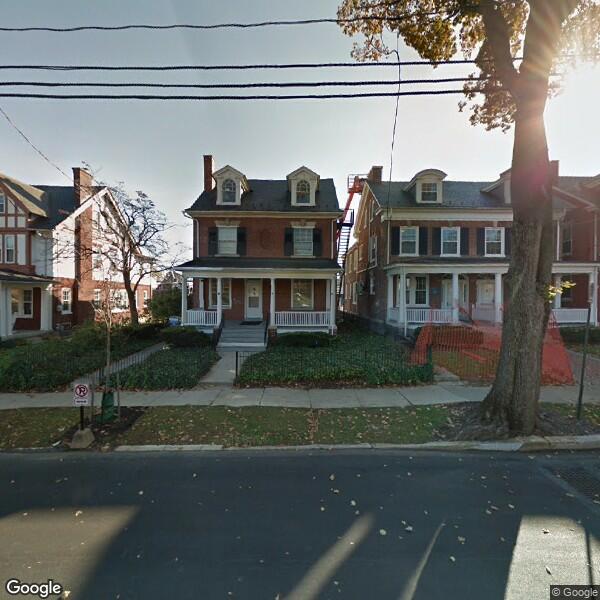
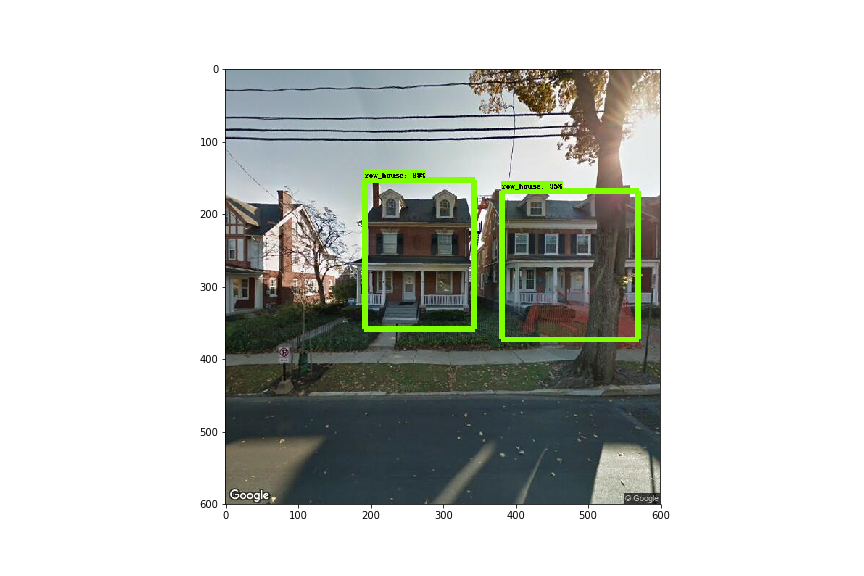
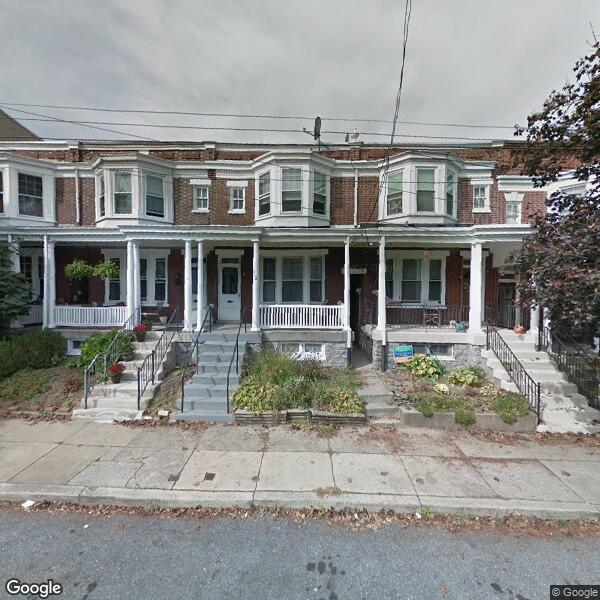
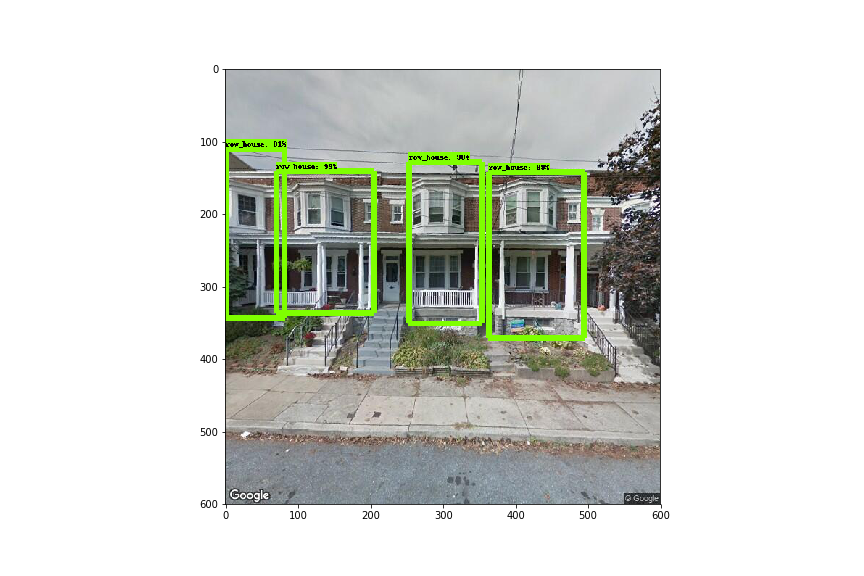
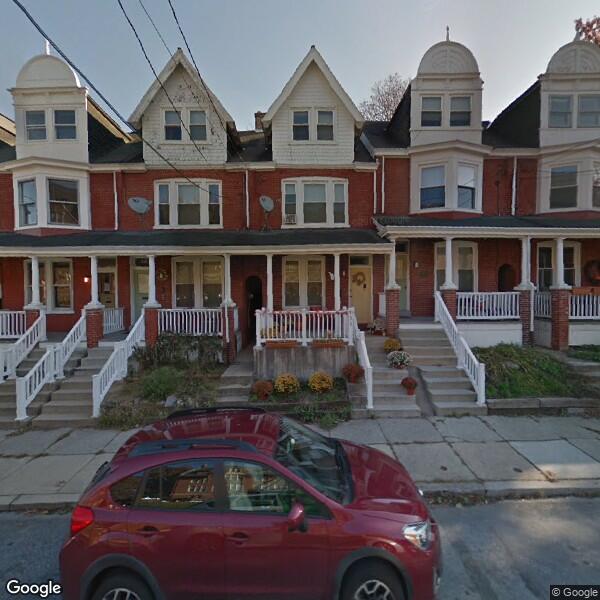
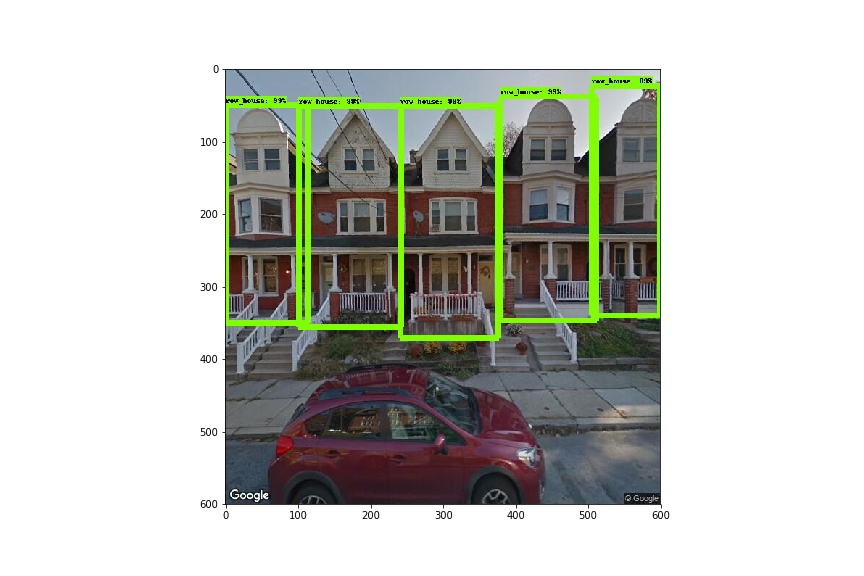
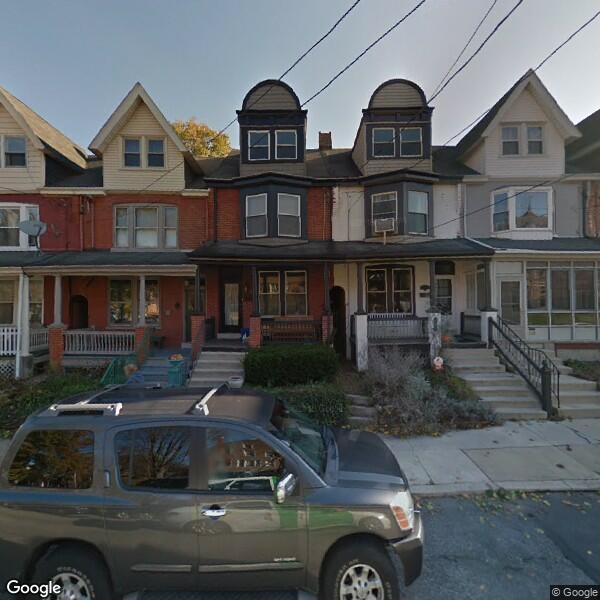
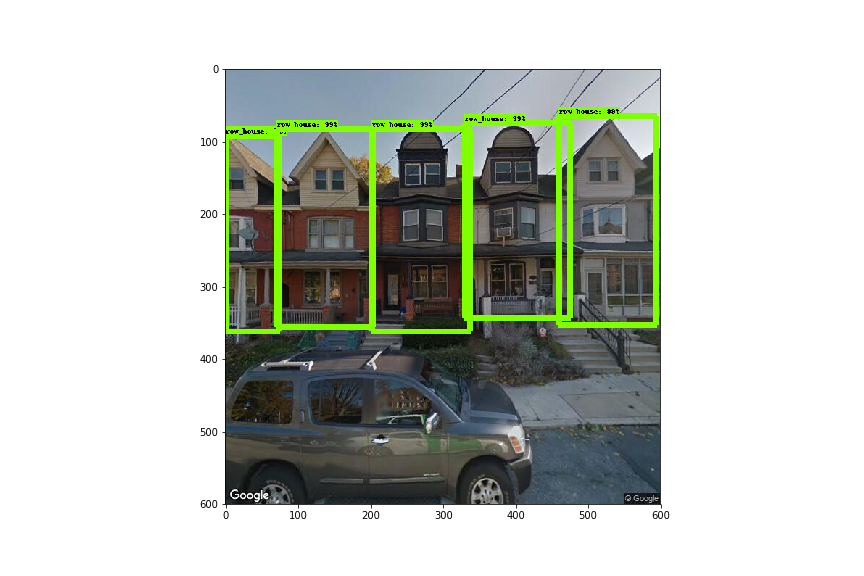
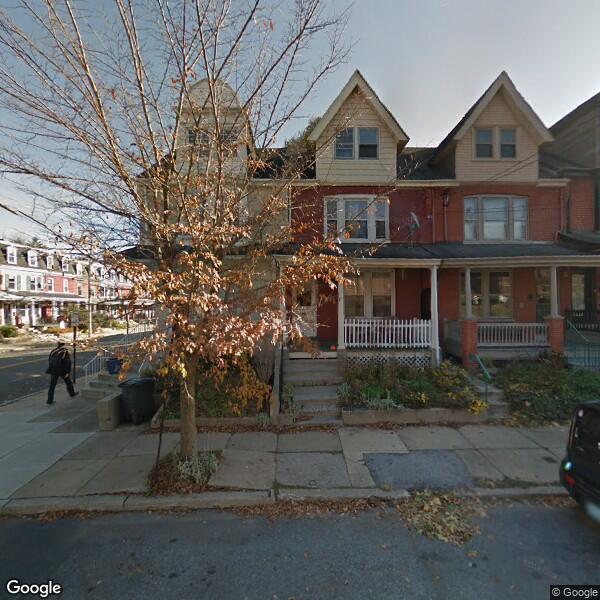
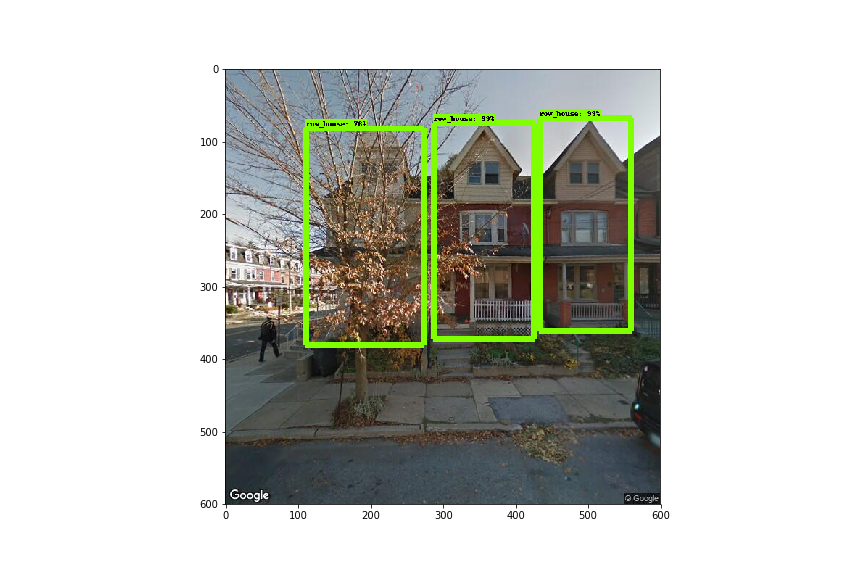
- Run some images through the model Images were downloaded through the Google Street View API and paid for with a personal account, the images are published here for demonstration purposes only and may not be used or referenced because Google lawyers. The images with the green boxes are the results of the object detection model for the previous input image.
- Detection of buildings that aren't row houses:
- Sometimes there was overlap or key features were not captured:
- Sometimes the detection was right on. It appears that some major features, like a peaked roof, can have significant influence.
- Sometimes detection could occur behind obstacles:
- Next steps
- Train the model on more images with differing labels for multiple categories of row house types
- Look into the details of the model, and different models, to see if performance/accuracy can be improved
- See if labels can be based on location, and if a model can be created that detects areas of the city with similar visual characteristics
- Compare object detection methods that are based on location labeling with peoples' perceptions of the boundaries of their neighborhood.
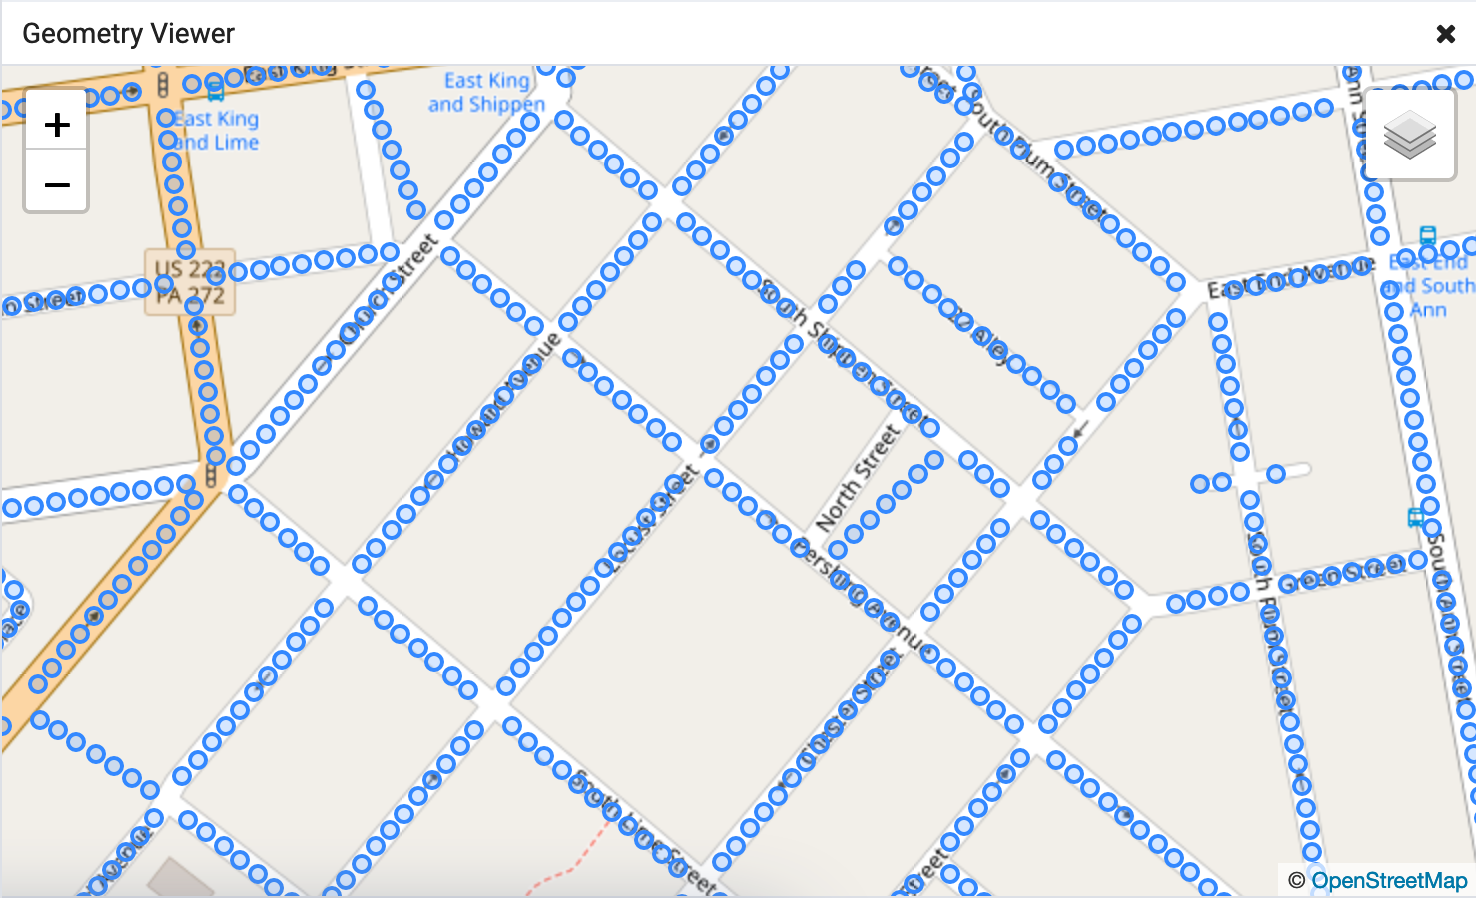
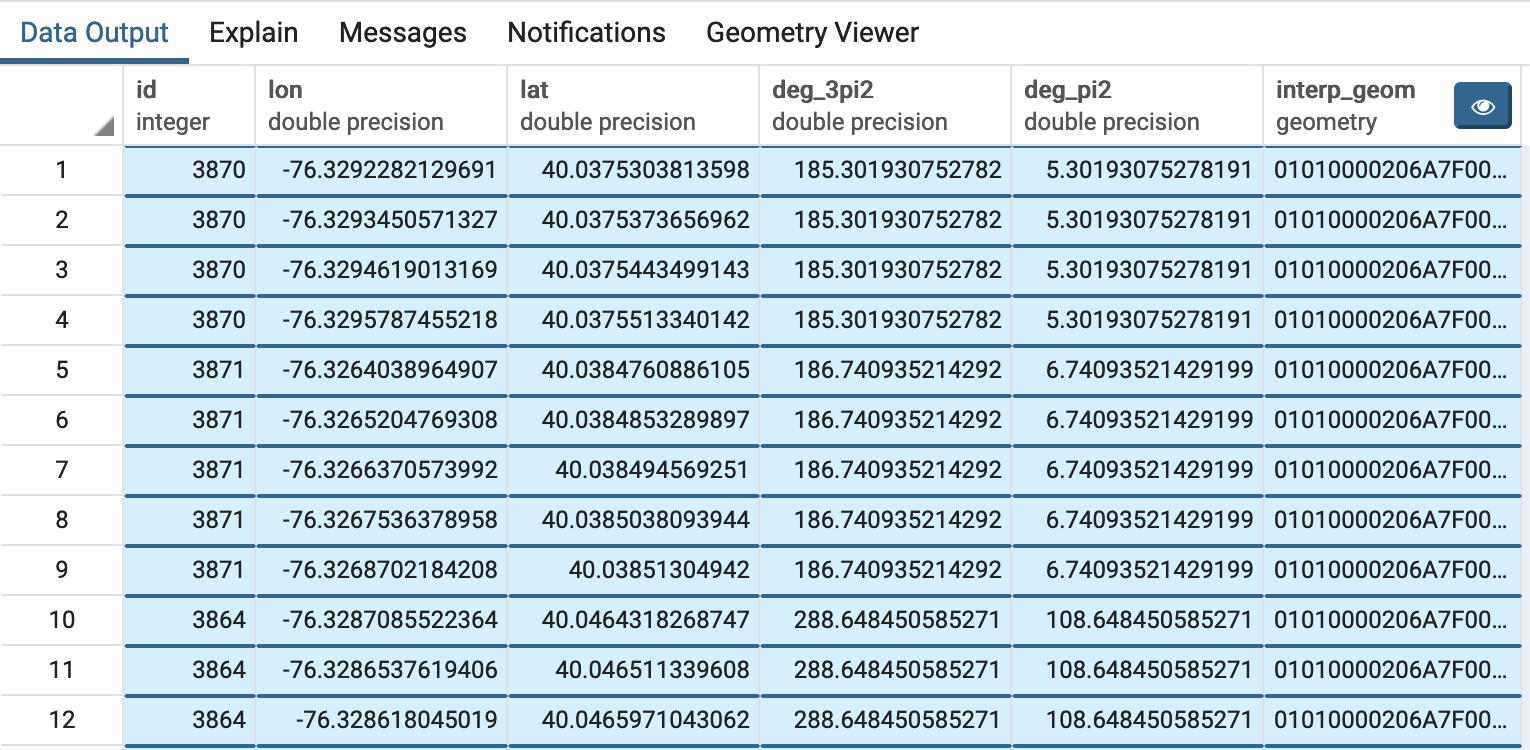
In order to get images of row houses along each street, a longitude and latitude value was calculated for each point every 10 meters along each street excluding intersections. A heading value was also obtained for the perpendicular angle based on the heading for each street in both directions using a PostGIS query on street geometries.
In order to get the points along each street and perpendicular headings in each direction, line geometries of the streets of Lancaster were downloaded from Census TIGER files, imported into a PostgreSQL/PostGIS database, filtered by feature class code for streets, and filtered spatially with a bounding box representing a basic extent of Lancaster City's boundary
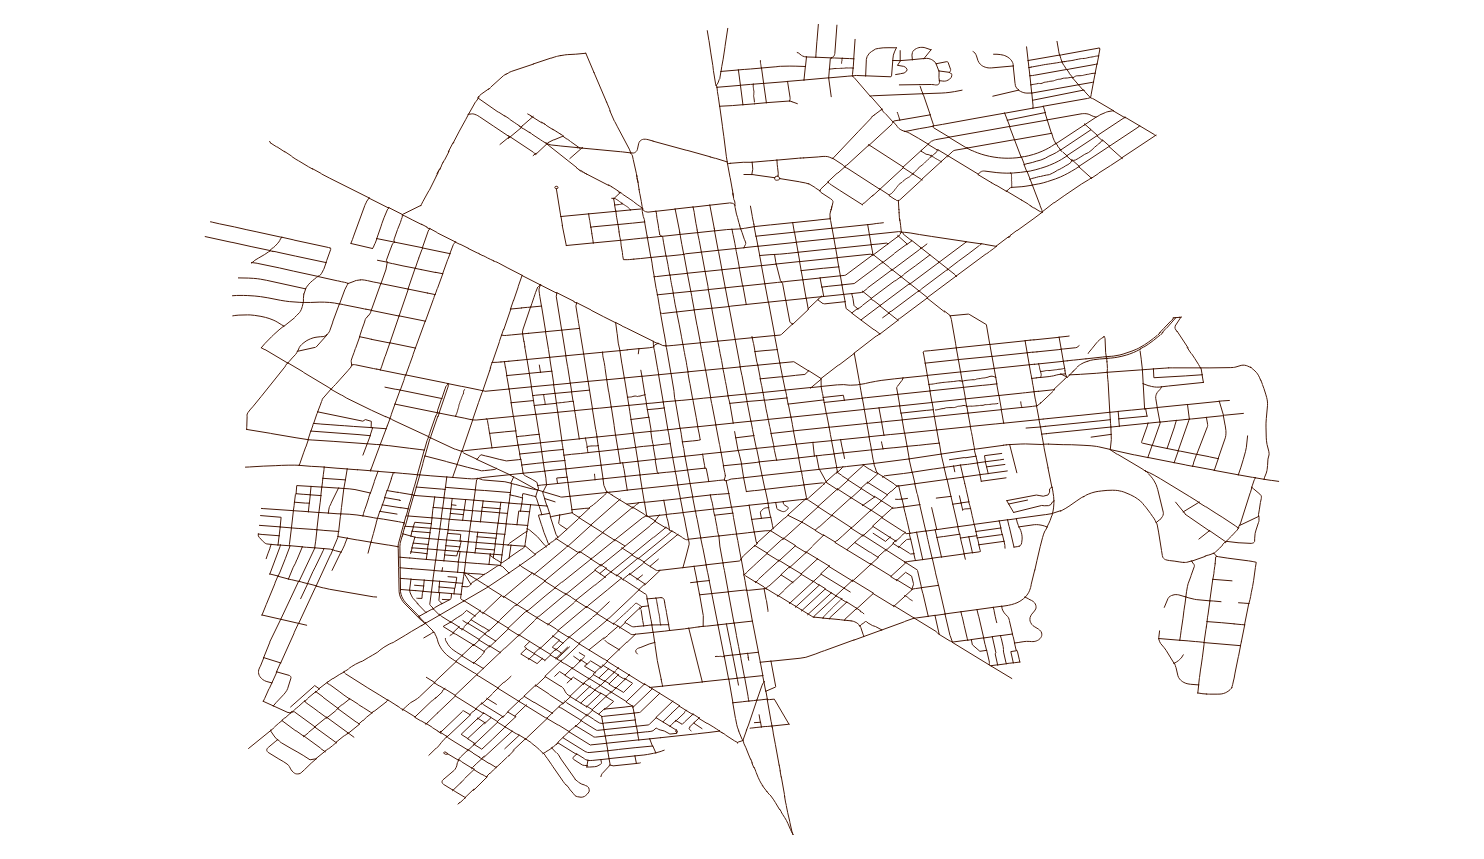
Once the street features were loaded, the following query was used to extract the necessary paramter values for the Google Street View API
          WITH
            --Transform the geometries for working in meters
            geom_transform as (
              SELECT id, (ST_Dump(ST_Transform(geom,32618))).geom as geom
              FROM lanco_edges_tl2018
            ),
            --Extract attributes from street lines
              --(length, remainder length for even spacing, azimuth, percent line length to start point series)
              line_attrs AS (
                SELECT *,
            	  ST_Length(geom) og_length,
            	  round(ST_Length(geom))::integer-mod(round(ST_Length(geom))::integer,10) sub_line_length,
            	  ST_Azimuth(ST_StartPoint(geom),ST_EndPoint(geom)) az,
            	  (mod(round(ST_Length(geom))::integer,10)::double precision/2)/ST_Length(geom) start_pct
            	  FROM geom_transform
              ),
            --Generate series of points 10 meters along each line starting from line_attrs.start_pct
              points_series as (
                SELECT *,
                       generate_series((og_length*start_pct)::integer+10, sub_line_length-1, 10) interp_dist
                FROM line_attrs
              ),
            --For each generated interpolation distance,
              --get the point geometry and it's perpendicular from the streets azimuth
              --in each direction (azimuth in radians converted to degrees)
              azimuths AS (
                SELECT *,
                       degrees(az+(3*pi()/2)) deg_3pi2,
                       degrees(az+pi()/2) deg_pi2,
                       ST_LineInterpolatePoint((ST_Dump(geom)).geom, interp_dist/og_length) interp_geom
                FROM points_series
              )
            --Get the id of the street feature,
              --the latitude and longitude of each point,
              --force degree headings into 0-360 domain,
              --the point geometry for visual QA
            SELECT id,
                   ST_X(ST_Transform(interp_geom,4326)) lon,
                   ST_Y(ST_Transform(interp_geom,4326)) lat,
                   CASE
                     WHEN deg_3pi2 > 360 THEN deg_3pi2-360
                     ELSE deg_3pi2
                   END,
                   CASE
                     WHEN deg_pi2 > 360 THEN deg_pi2-360
                     ELSE deg_pi2
                   END,
                   interp_geom
            FROM azimuths;
          import requests
          import shutil
          import csv
          import json

          api_streetview_url = "https://maps.googleapis.com/maps/api/streetview"
          api_metadata_url = "https://maps.googleapis.com/maps/api/streetview/metadata"
          api_key = '*'

          sv_images_dir = '/'
          sv_locations_csv = '/'

          def sv_api_call_save_image(url, params, filename):
              sv_request = requests.get(url, params=params, stream=True)
              with open(filename, 'wb') as f:
                  sv_request.raw.decode_content = True
                  shutil.copyfileobj(sv_request.raw, f)
              f.close()

          def sv_api_call_has_results(url, params):
              sv_request = requests.get(url, params=params)
              md_json = json.loads(sv_request.text)
              if md_json["status"] == 'ZERO_RESULTS':
                  return (False, None)
              else:
                  return (True, md_json)

          with open(sv_locations_csv, mode='r') as csv_file:
              csv_reader = csv.DictReader(csv_file)
              for row in csv_reader:
                  params = {}
                  params["size"]="600x600"
                  params["location"]="{lat},{lon}".format(lat=row["lat"][0:9], lon=row["lon"][0:10])
                  params["key"]=api_key
                  params["radius"]=5
                  has_results = sv_api_call_has_results(api_metadata_url, params)
                  if has_results[0] == True:
                      pano_id = has_results[1]["pano_id"]
                      params["heading"]=row["deg_3pi2"]
                      filename = "{dir}{row_id}-{pano_id}-{heading_suffix}".format(dir=sv_images_dir,
                          row_id=row["id"],
                          pano_id=pano_id,
                          heading_suffix="deg_3pi2.png")
                      sv_api_call_save_image(api_streetview_url, params, filename)
                      params["heading"]=row["deg_pi2"]
                      filename = "{dir}{row_id}-{pano_id}-{heading_suffix}".format(dir=sv_images_dir,
                          row_id=row["id"],
                          pano_id=pano_id,
                          heading_suffix="deg_pi2.png")
                      sv_api_call_save_image(api_streetview_url, params, filename)
Now that the proof of concept is working the next steps could be: